The dashboard serves as a comprehensive tool for gaining insights and clarity into the progress of your work. This article explains its features, which enable you to monitor data across diverse categories on the platform.
For extensive research projects, a large amount of data accumulates on the platform. Keeping track and understanding the progress of the work can be challenging at times. The dashboard provides assistance in this matter: Here, you can view information on data from categories such as Artworks, Sales Catalogues, Publications, Media, and Archival Collections. For example, you can see how many data sets have already been published or how many connections exist between data sets.
1. Find the dashboard in the submenu of the Master Data section
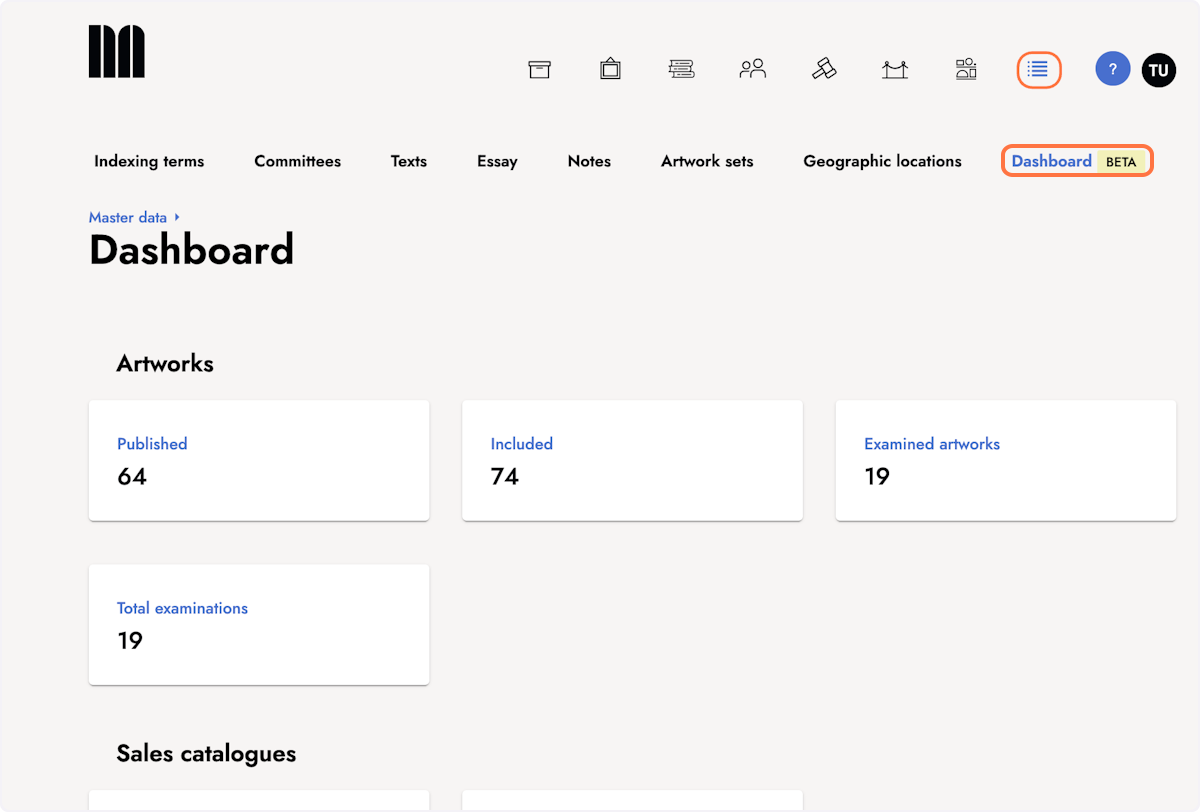
2. Click a field to get more insights about the corresponding area.
The different categories include one or multiple areas. For example, the category Artworks is split in the areas Published, Included, Examined artworks, and Total examinations. These areas provide the respective insights.
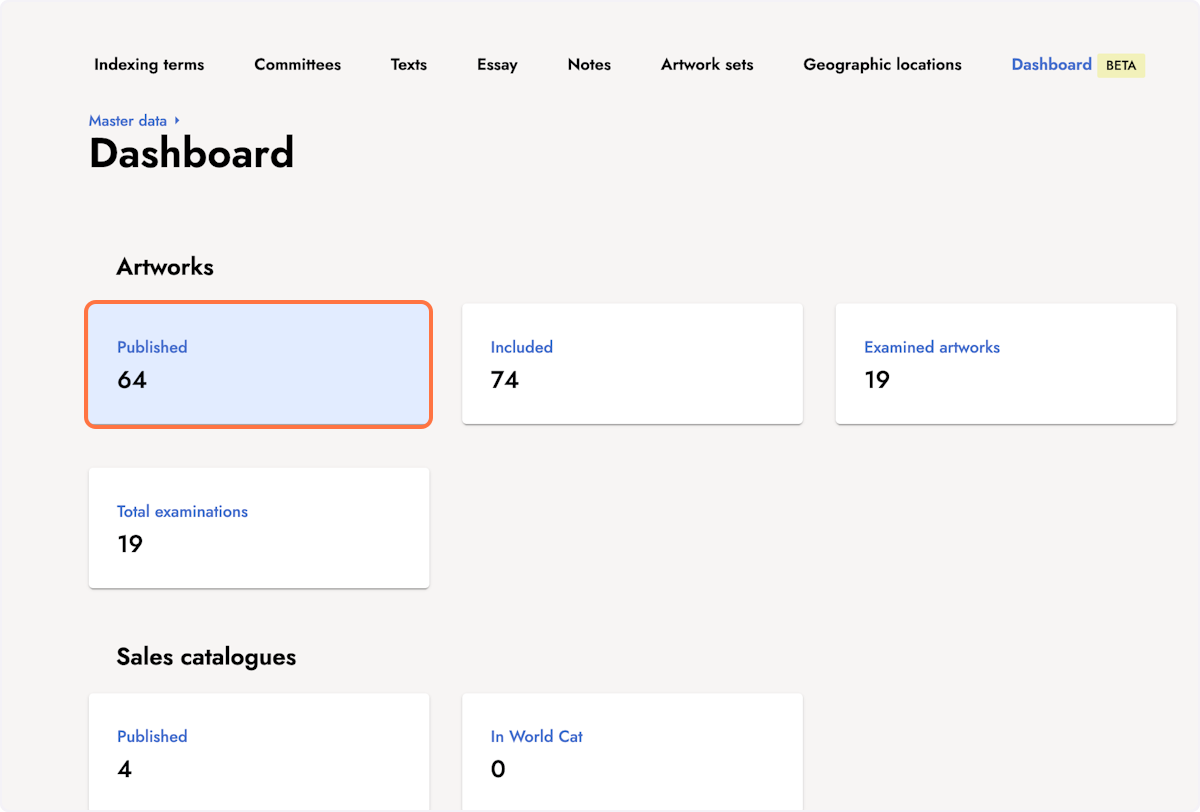
3. Get details about published artworks.
After you click Published, you're forwarded to a detail view of the published artworks. This detail view provides data about private, published, and unpublished artworks, as well as the total number of artworks on the platform.
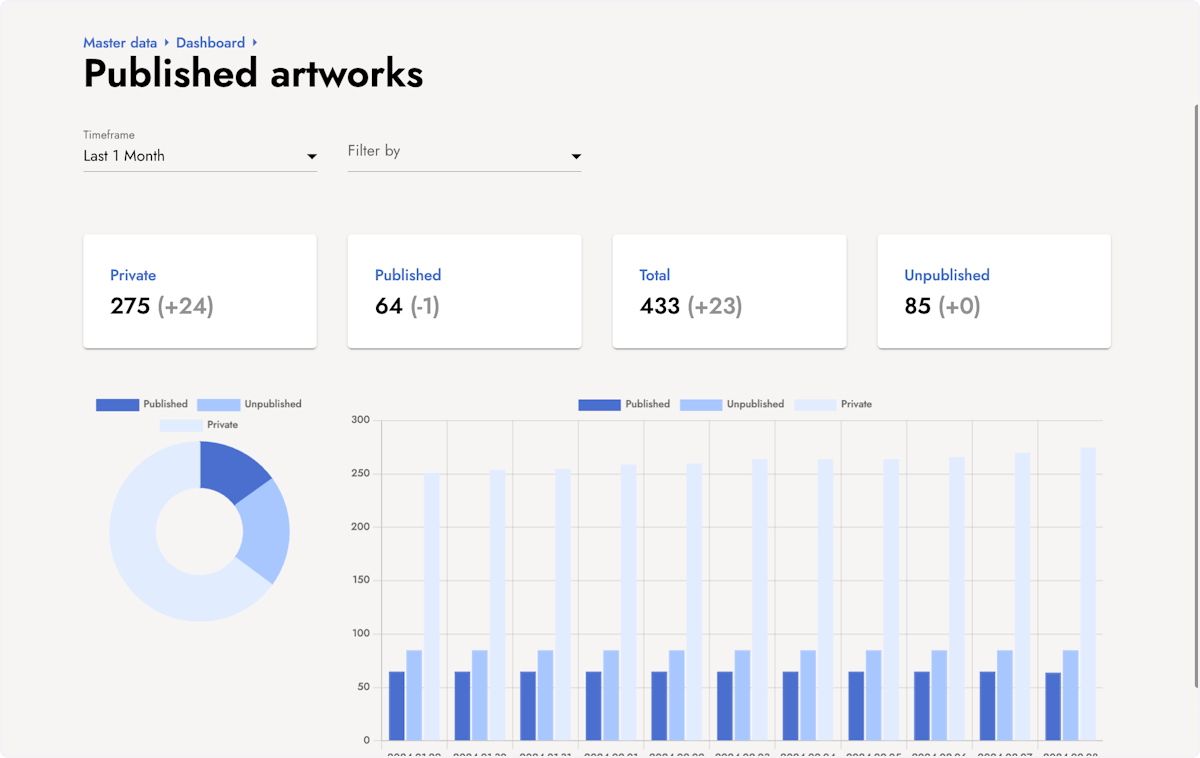
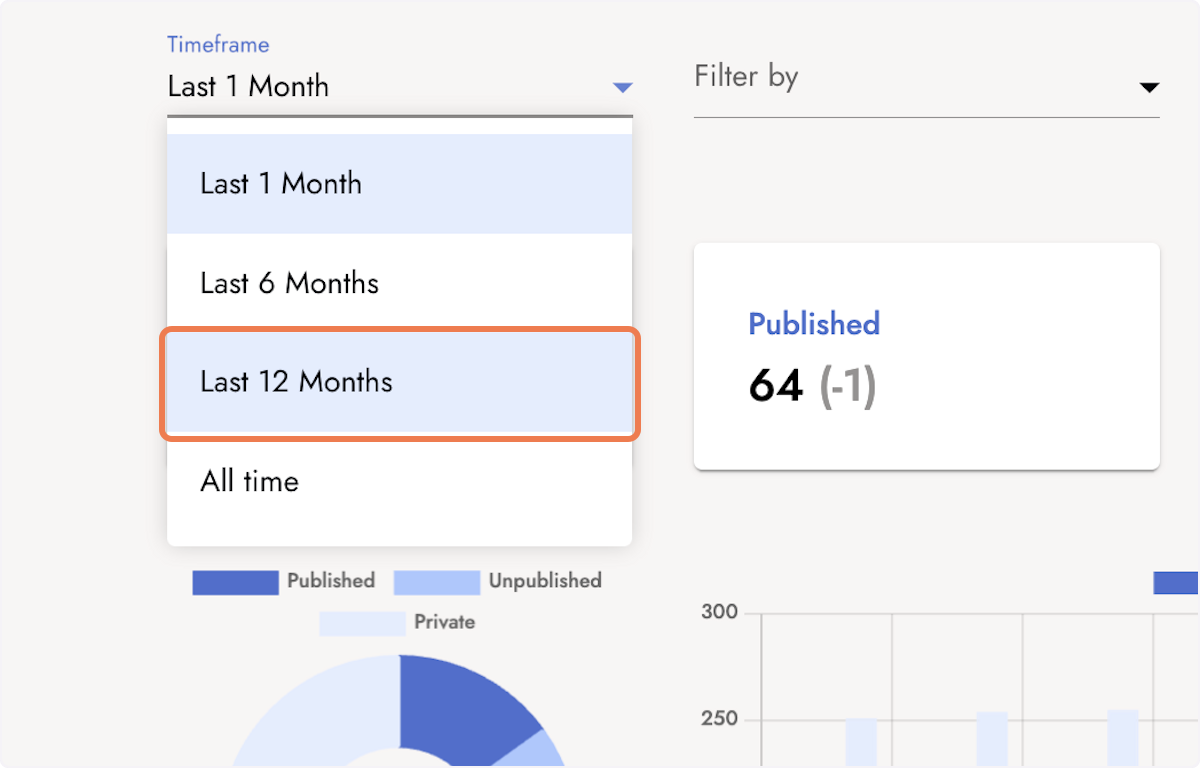
4. Select a timeframe
You can select different timeframes to filter your results accordingly, helping in tracking progress within specific periods.
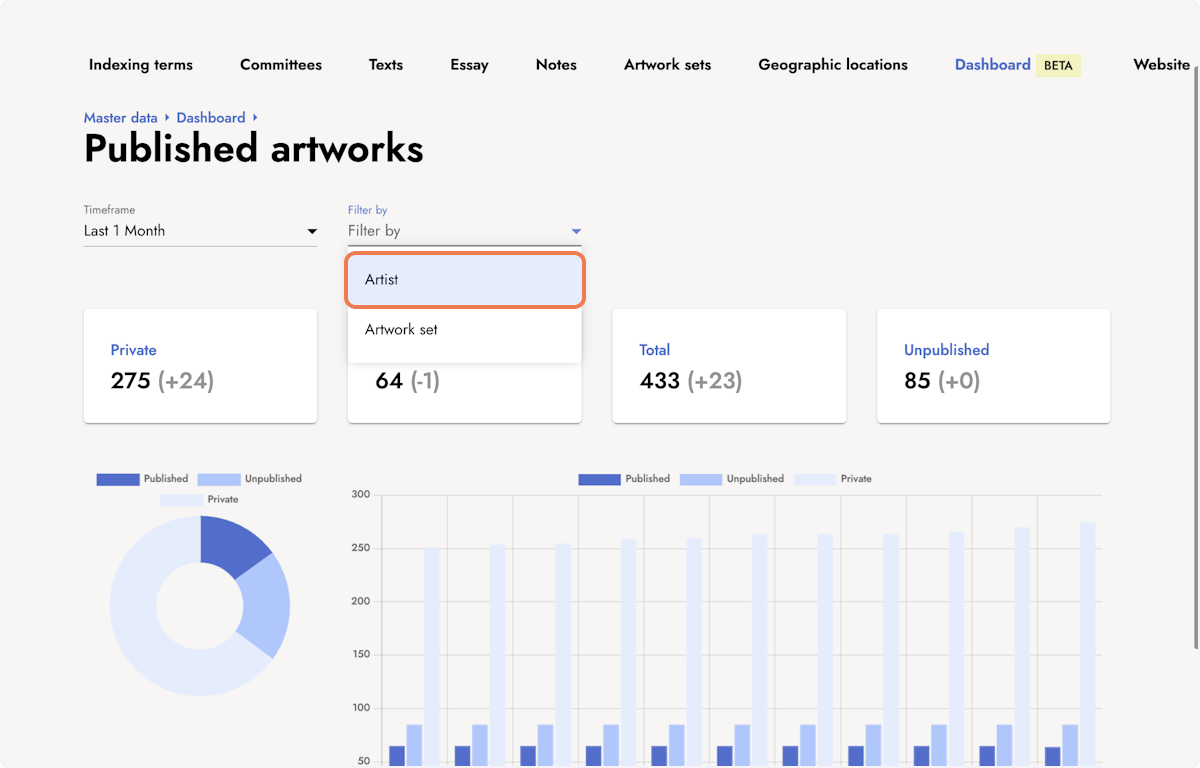
5. Filter by Artist
You can filter Artworks by Artist or Artwork set.
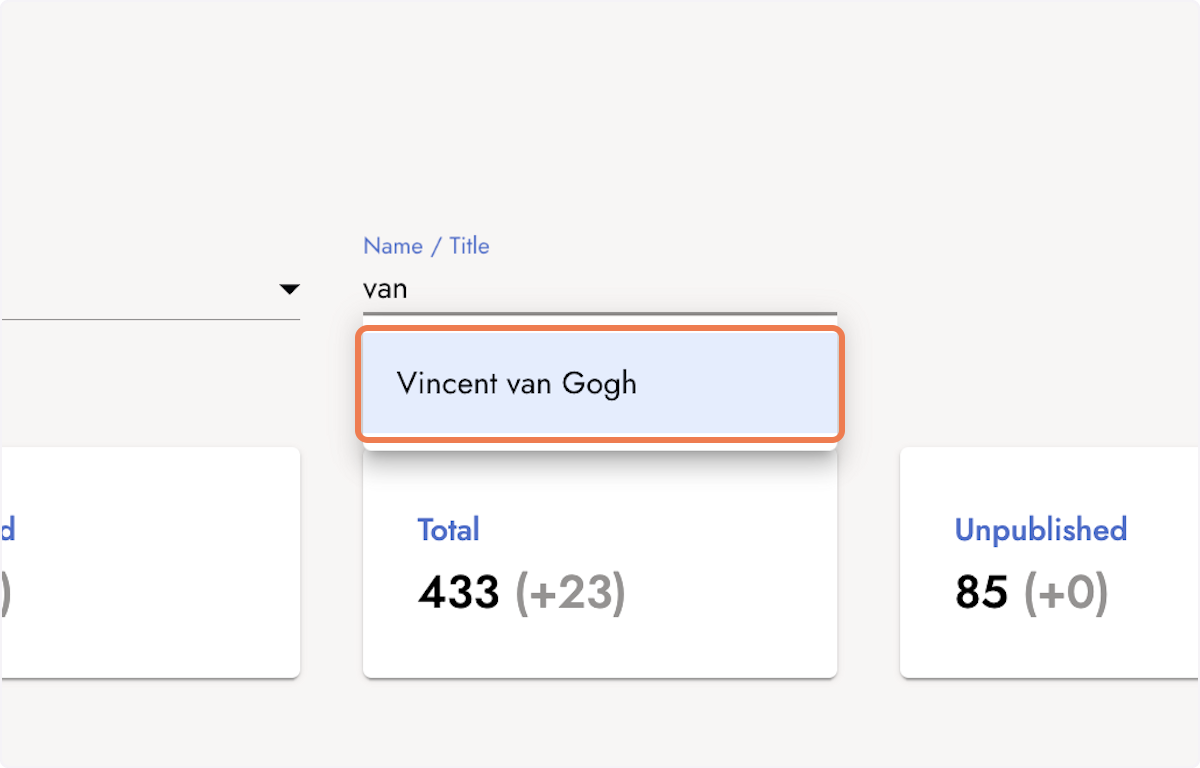
6. Enter the artist you want to filter by and select an option from the drop down menu.
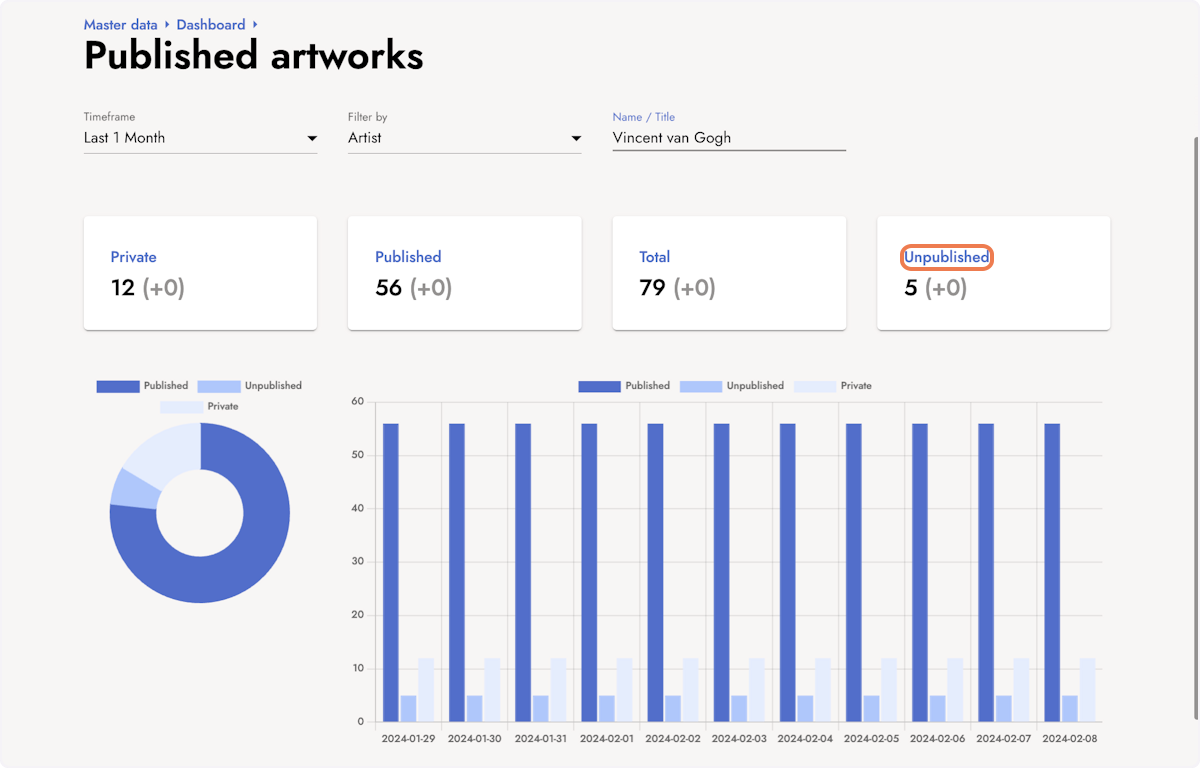
7. See the filtered results.
Filtering results based on the artist or artwork set allows you to focus on the metrics of one project.
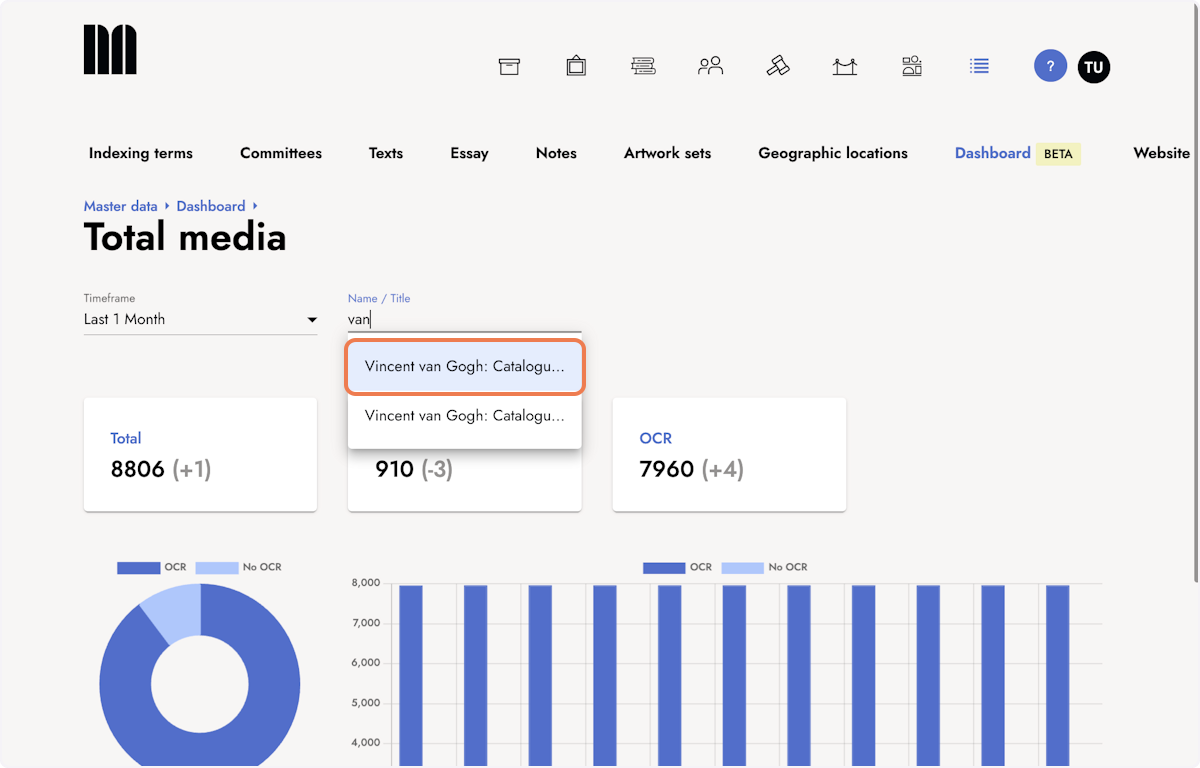
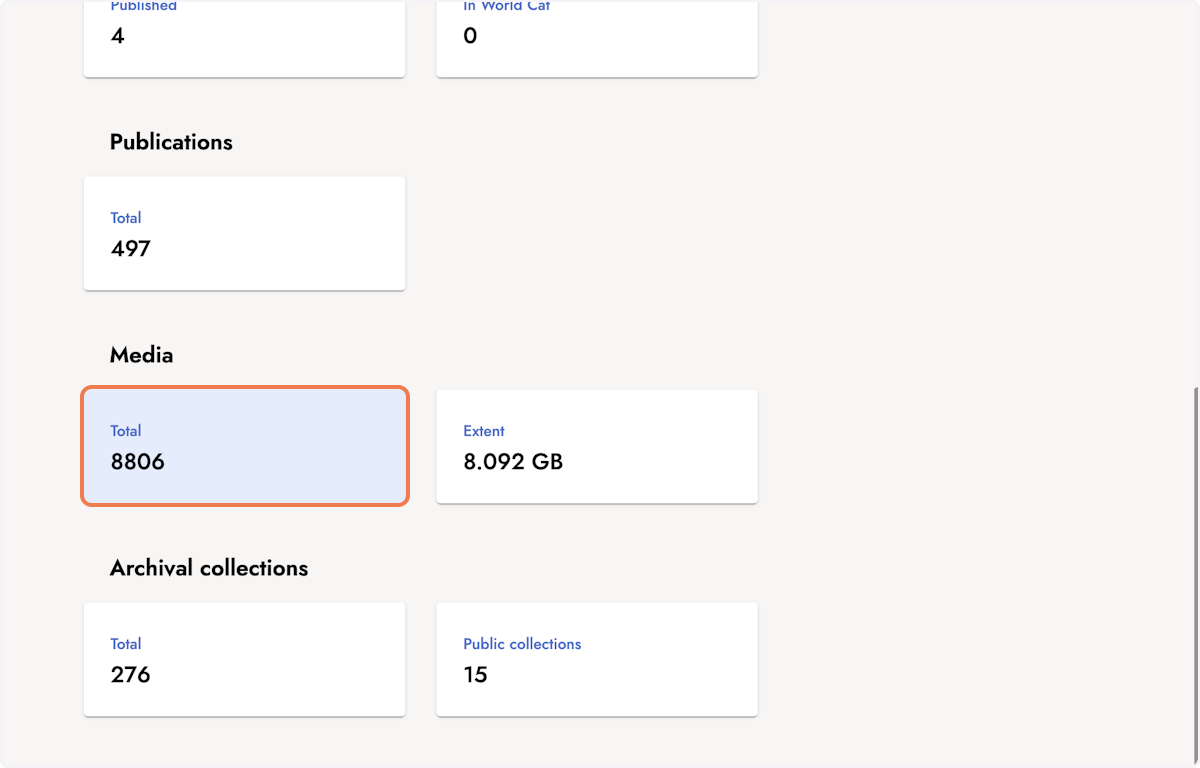
8. Click the filed Total to get more insights about the media.
The category Media is split in two areas: Total and Extent.
9. Filter by archival collection.
After clicking Total, you're forwarded to a detail view of the media on the platform. Here you can filter your metrics by an archival collection. Enter the title and select an option from the drop down menu.